B Impact Analytics
Helping aggregators and companies measure and improve ESG performance with a data-driven analytics tool.
My Role
UX Research, UX Design, UI Design
Team
Me, Product Manager, Rotational Team of 12 Developers
The Context
B Lab previously released a limited analytics tool that was cumbersome and required heavy support.
Ad hoc feature additions created a disjointed experience with a steep learning curve. Aggregators struggled to view ESG performance across multiple companies and lacked actionable insights.
Our goal was to design B Impact Analytics, a tool that empowers users to monitor, benchmark, and act on ESG data at scale.
The Opportunity
Redesigning analytics to support real user workflows and engagement outside certification cycles.
Aggregators—investors, consultants, and impact managers—needed aggregated data and actionable insights to manage ESG performance across multiple companies.
Replacing the old tool allowed us to define an MVP aligned with user needs and create a robust analytics experience integrated with B Lab’s platform.
Research
We explored user workflows, pain points, and needs for managing ESG data.
Methods included support ticket analysis (1,000+ tickets), usage metrics review, and two rounds of user interviews with existing users and aggregators.
Key findings: unclear navigation, limited aggregated reporting, need for goal tracking, and actionable insights.
The Solution
Designing a platform that delivers aggregated ESG insights and supports actionable decision-making.
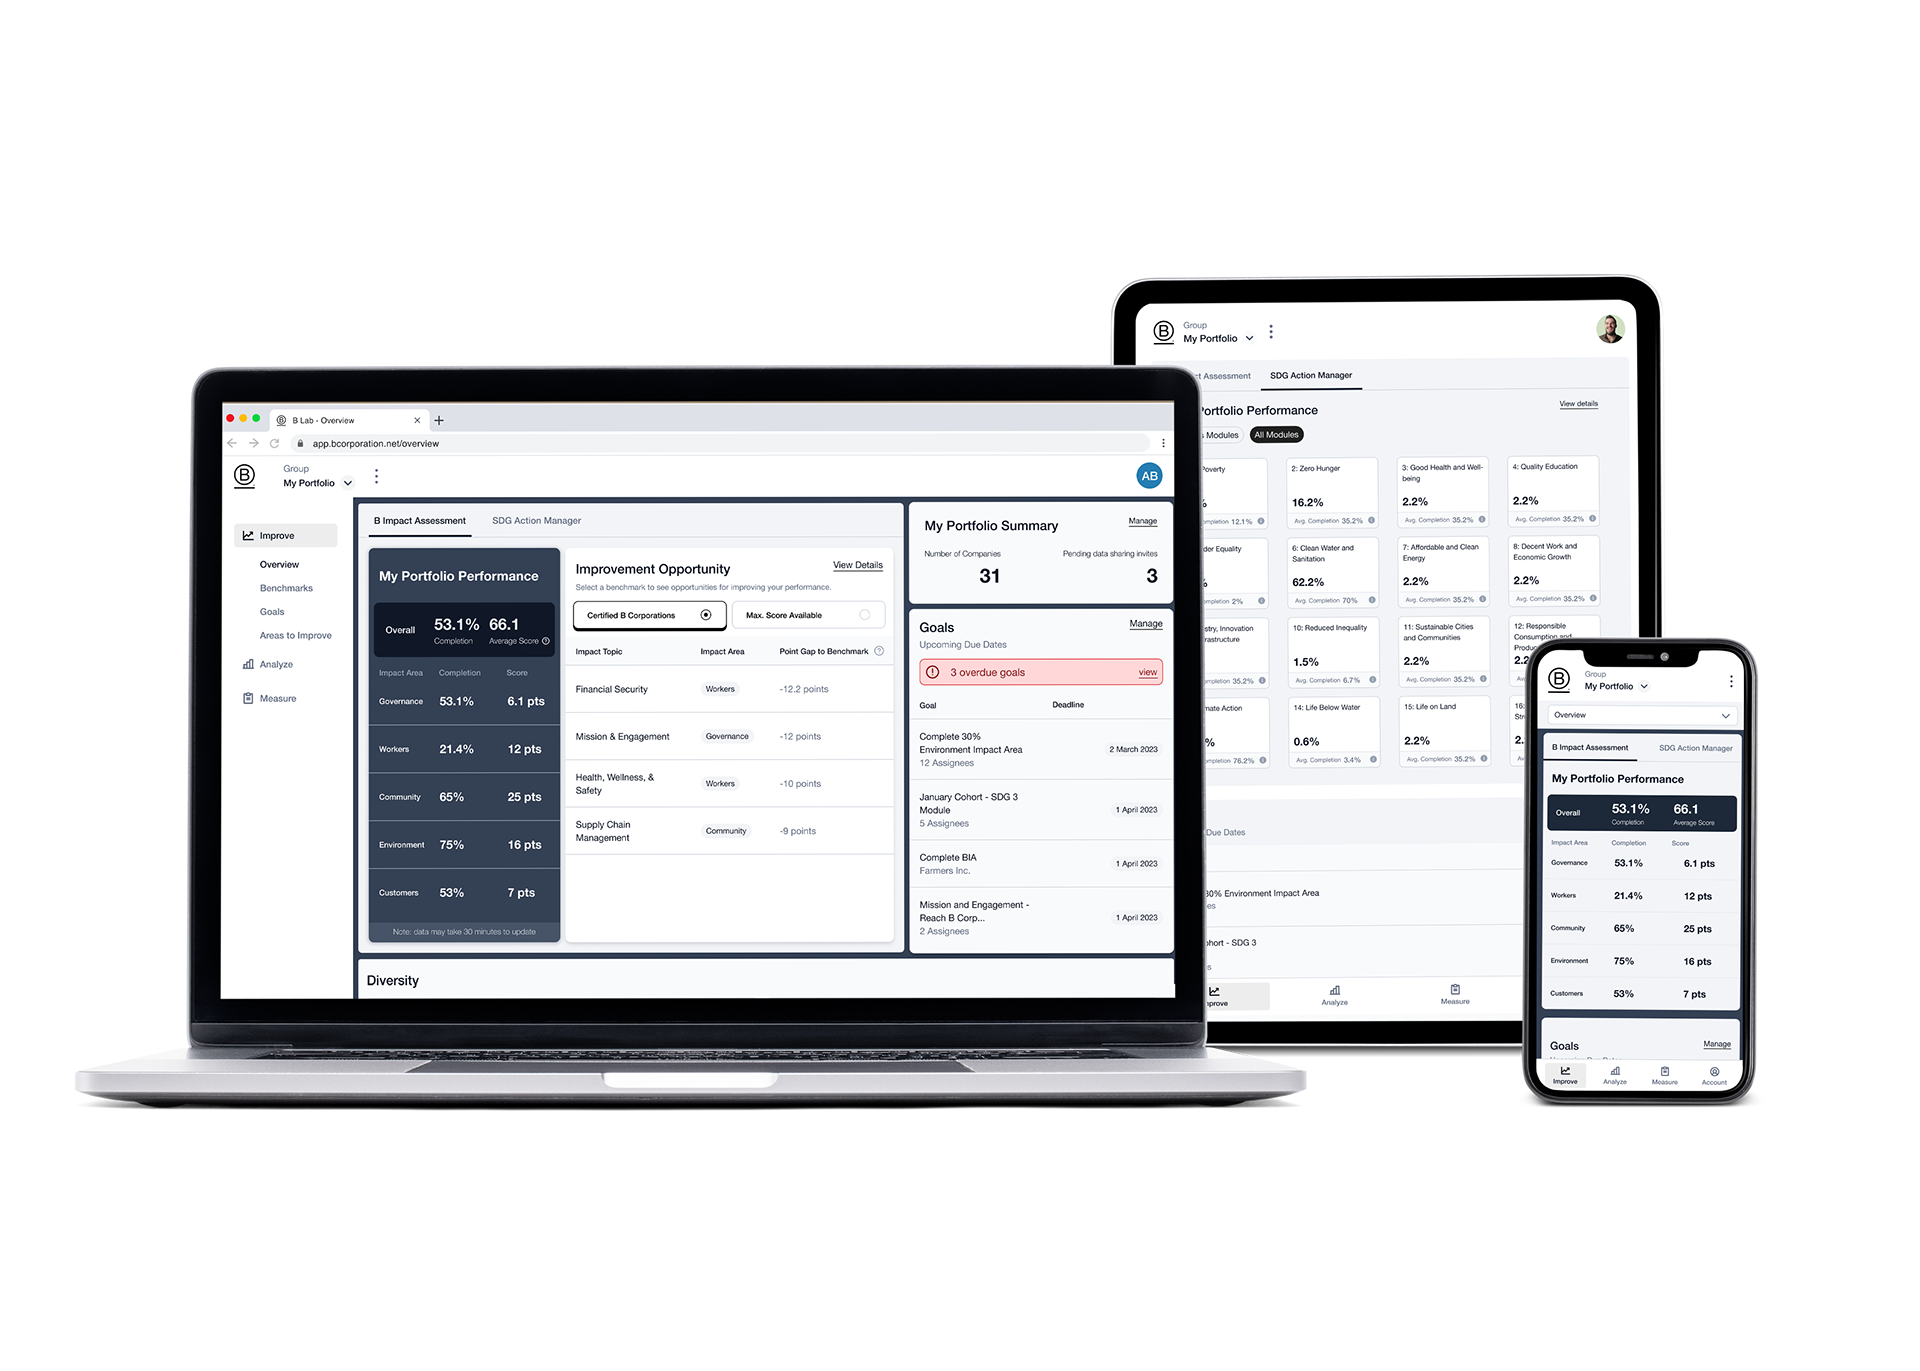
Aggregate Dashboard with Actionable Metrics
overview
Provide a high-level dashboard that shows ESG performance across multiple companies, highlighting strengths, weaknesses, and opportunities for improvement at a glance.
problem solved
Previously, users had to review company data one by one, making it difficult to see the big picture or spot trends. The aggregate dashboard centralizes data and surfaces insights to drive more effective decision-making.

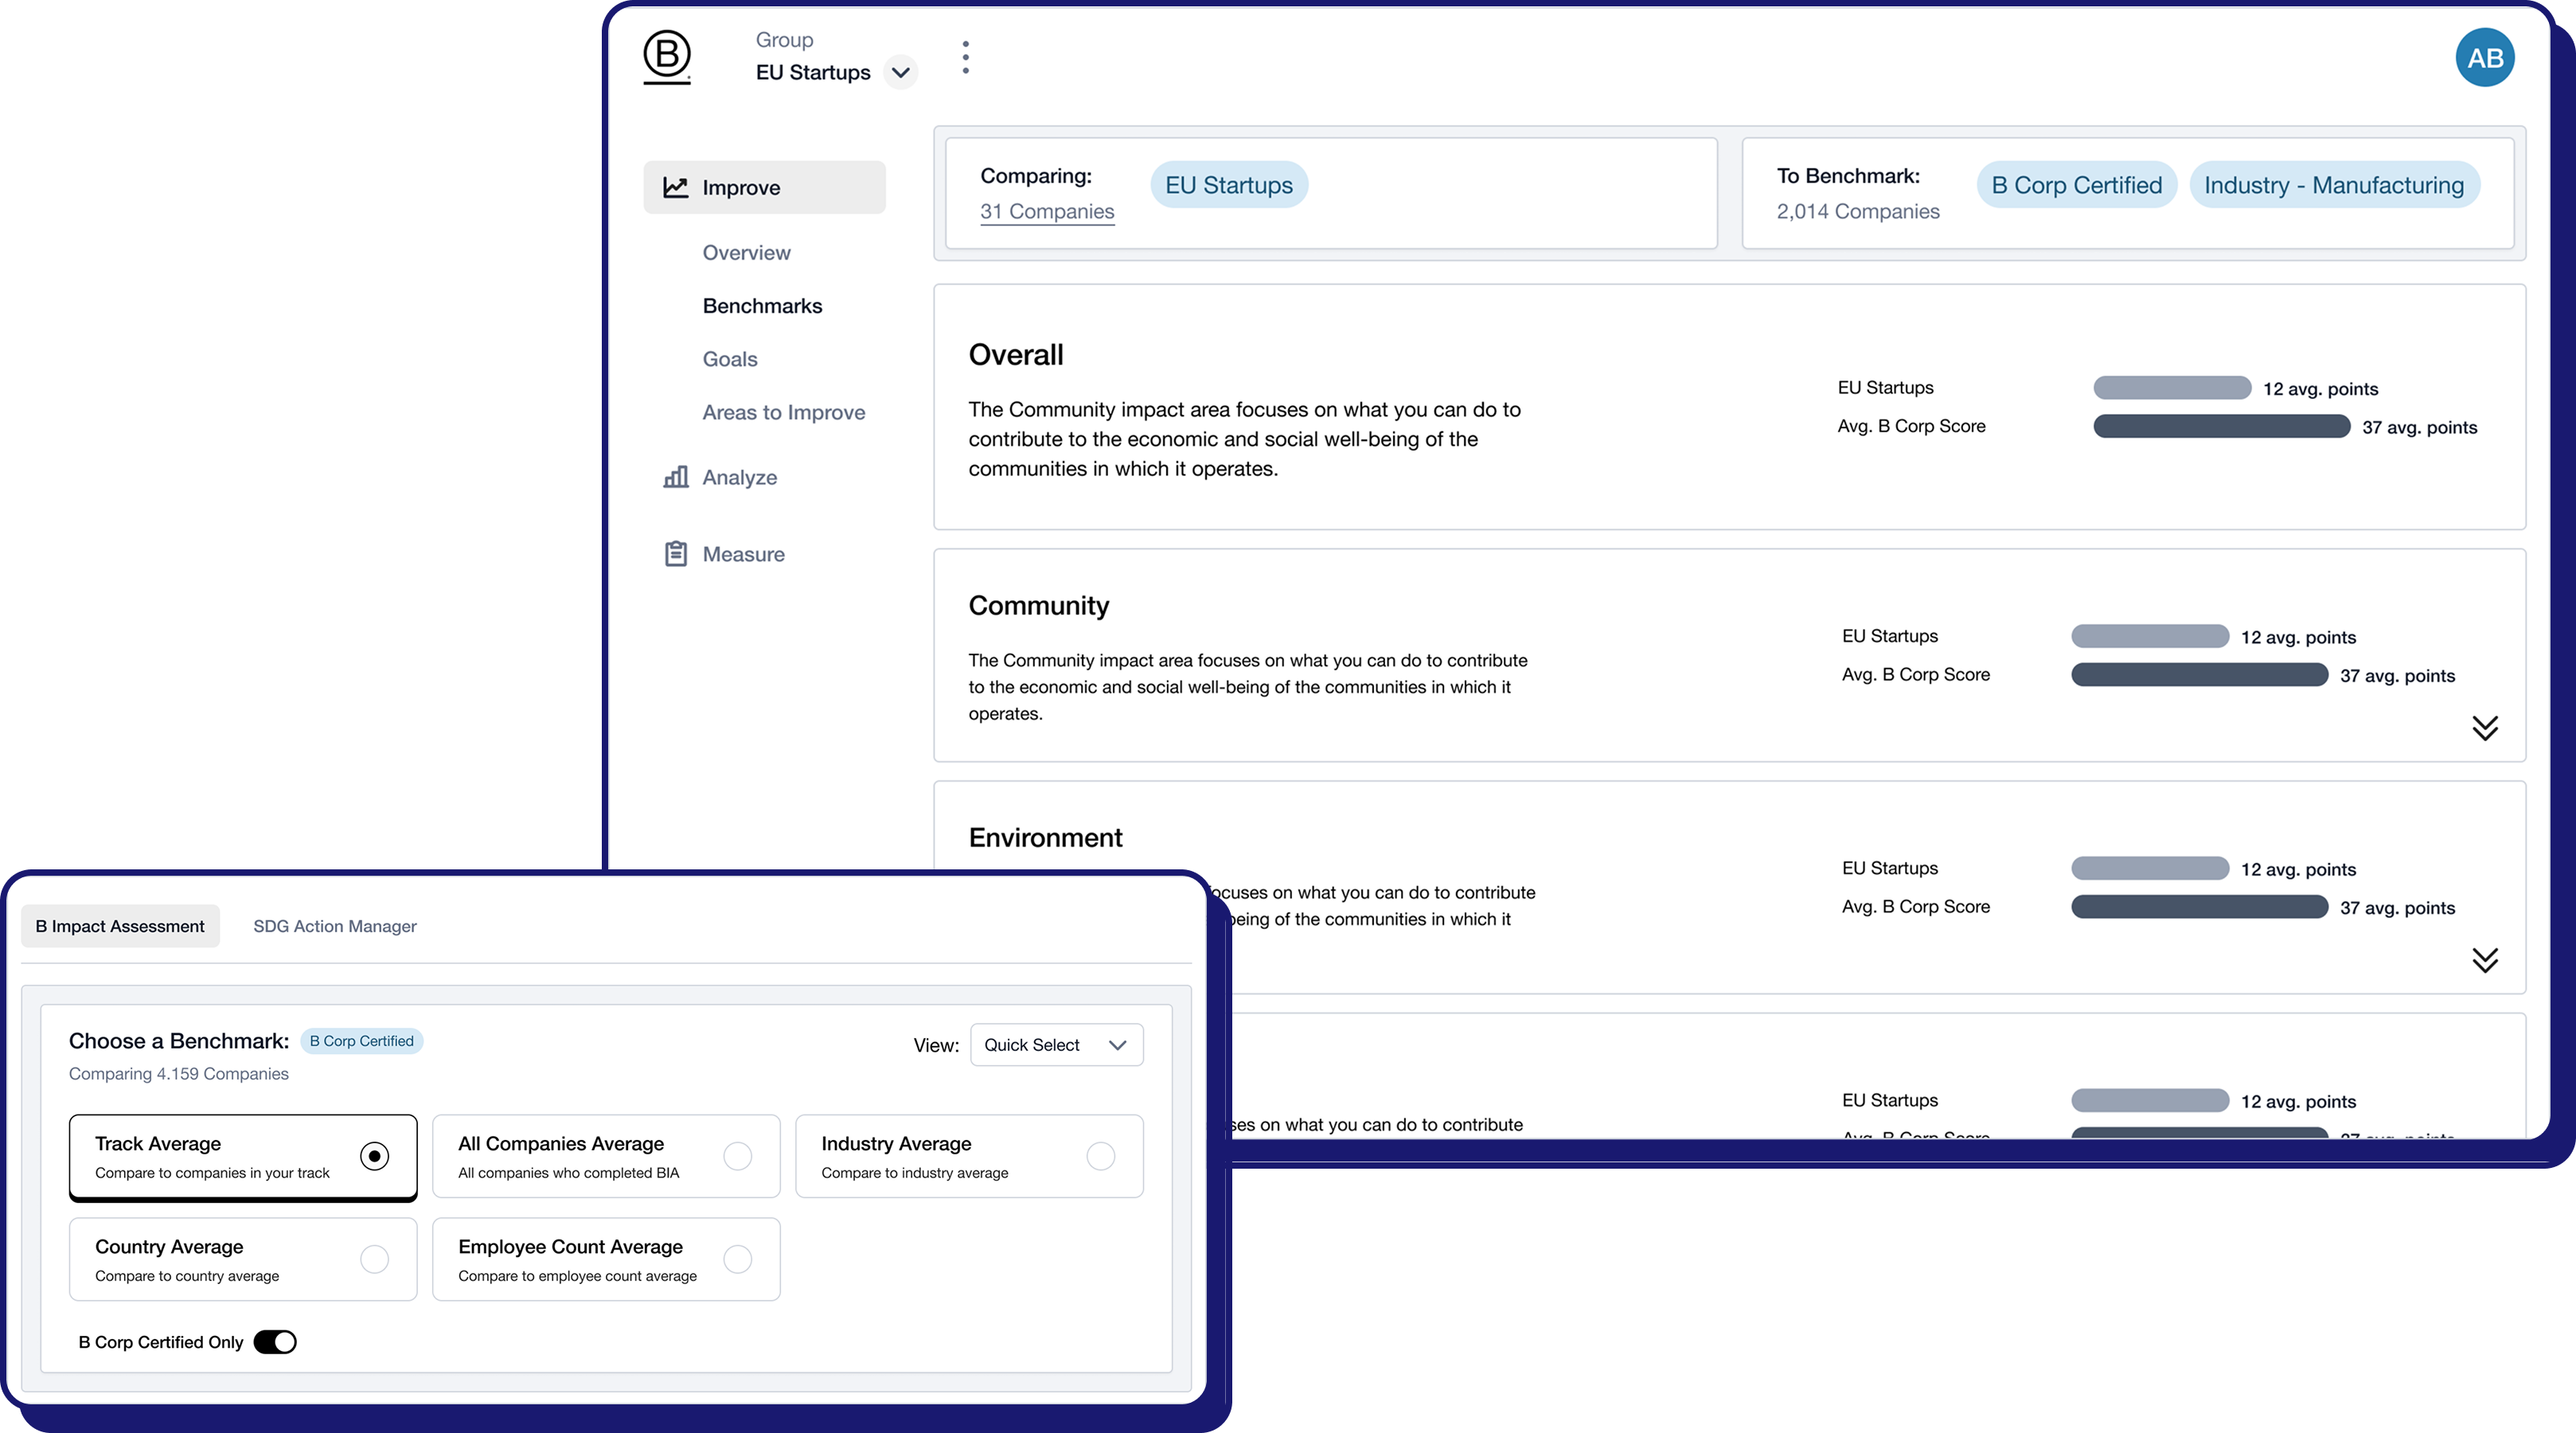
Benchmarks to Compare Performance
overview
Allow users to benchmark companies against peers by industry, size, or geography, giving them meaningful context for performance evaluation.
problem solved
Without benchmarks, users couldn’t understand whether performance scores reflected strengths or risks. Benchmarks provide the context needed to identify opportunities and set realistic improvement targets.
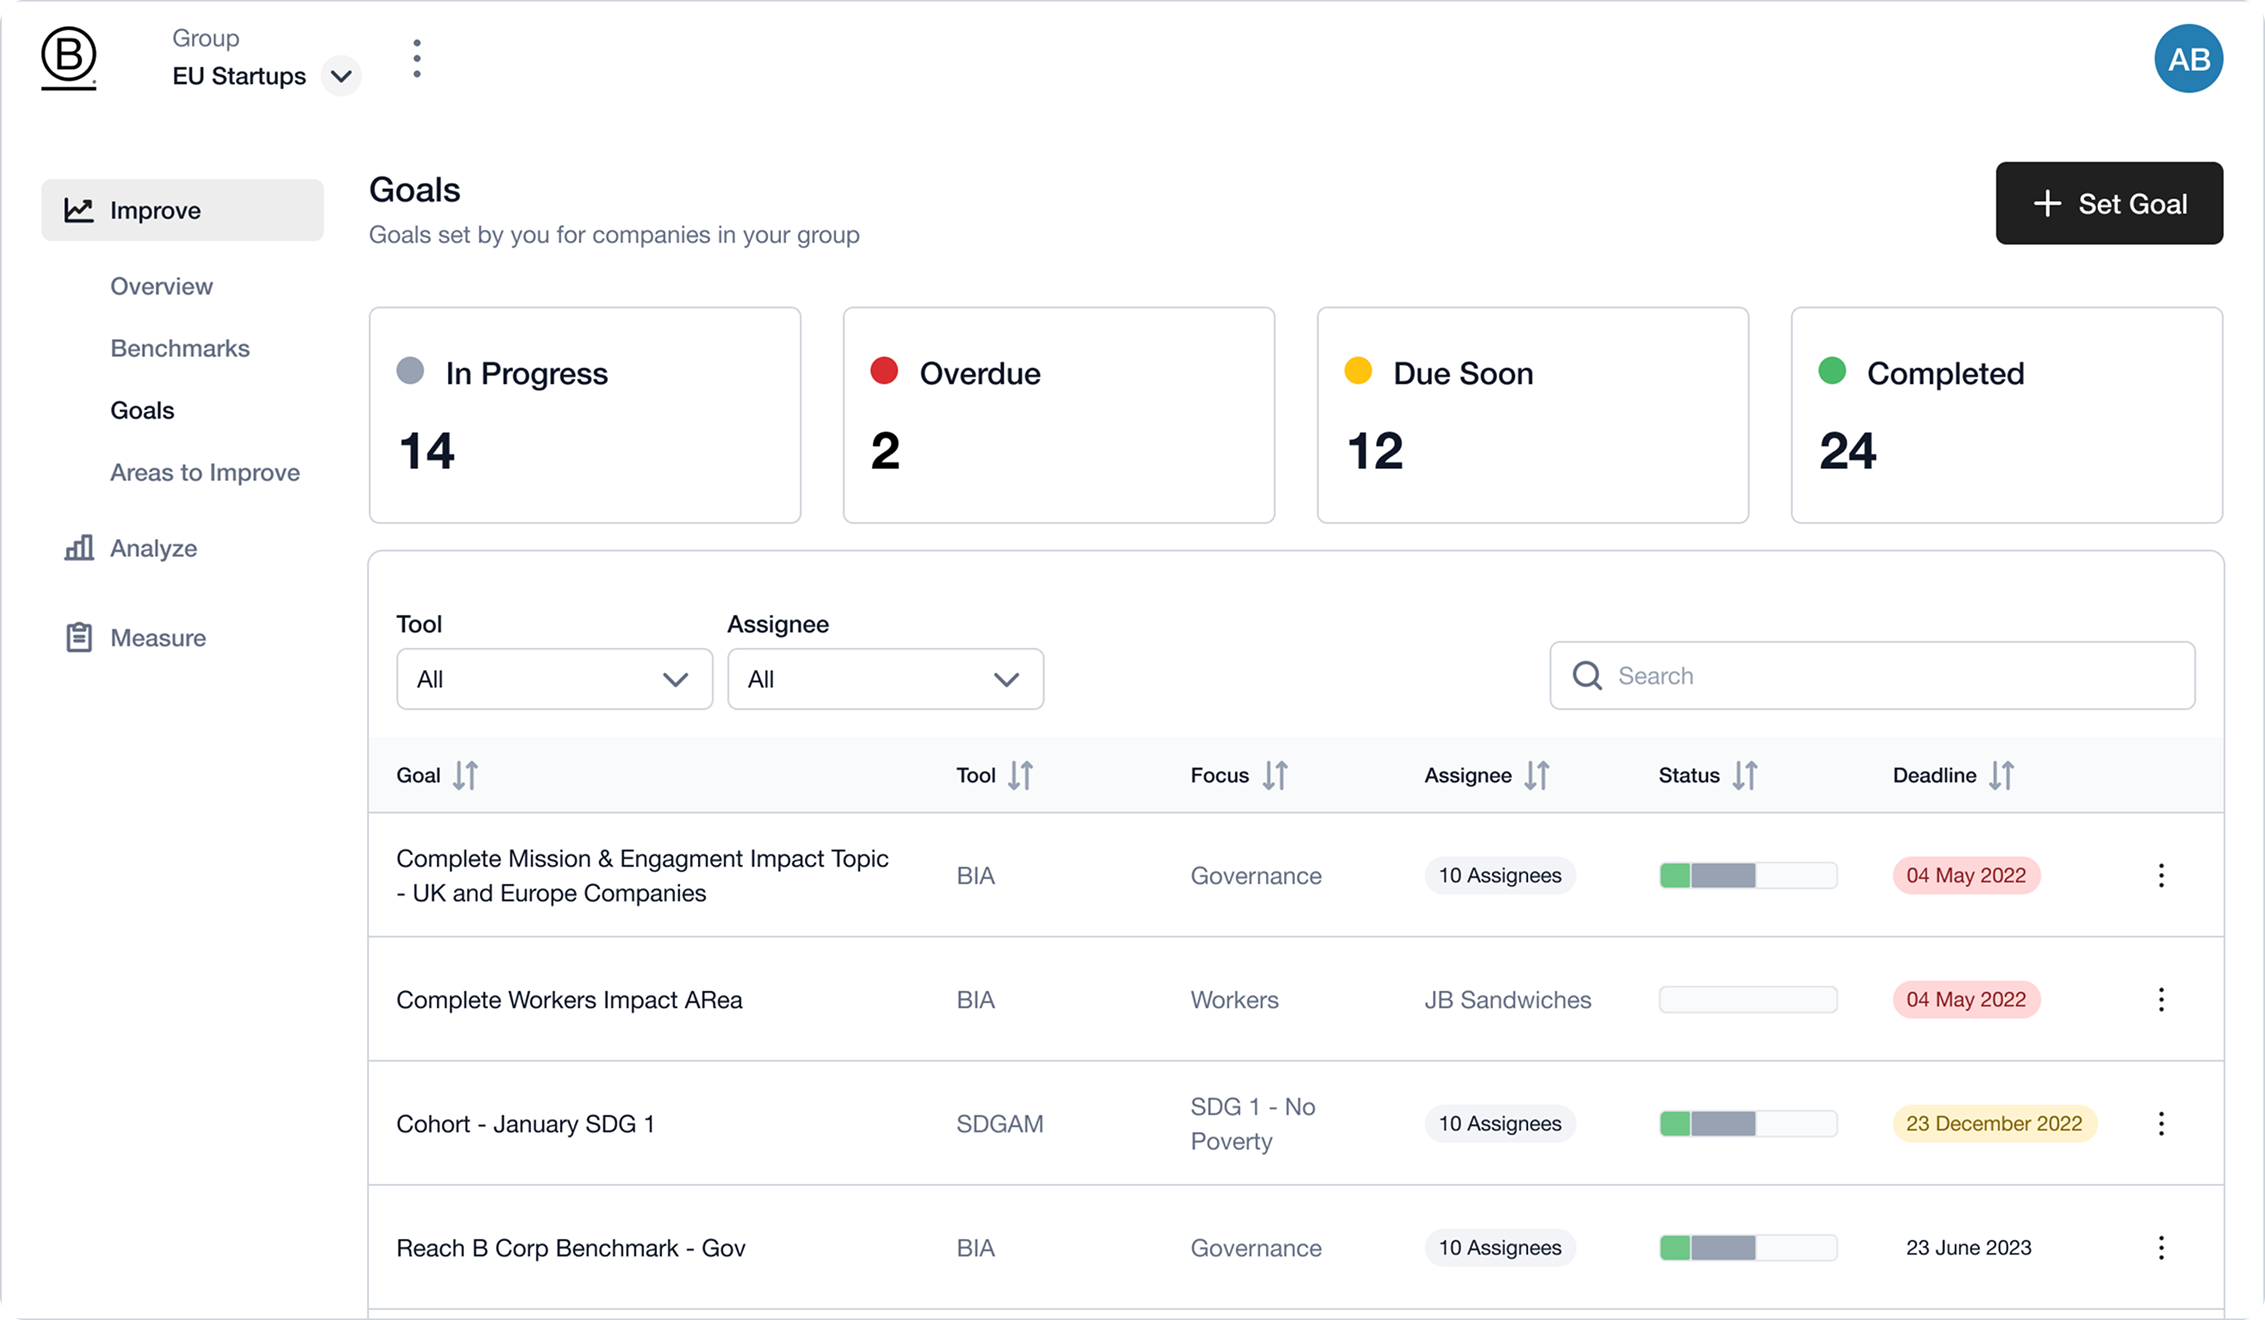
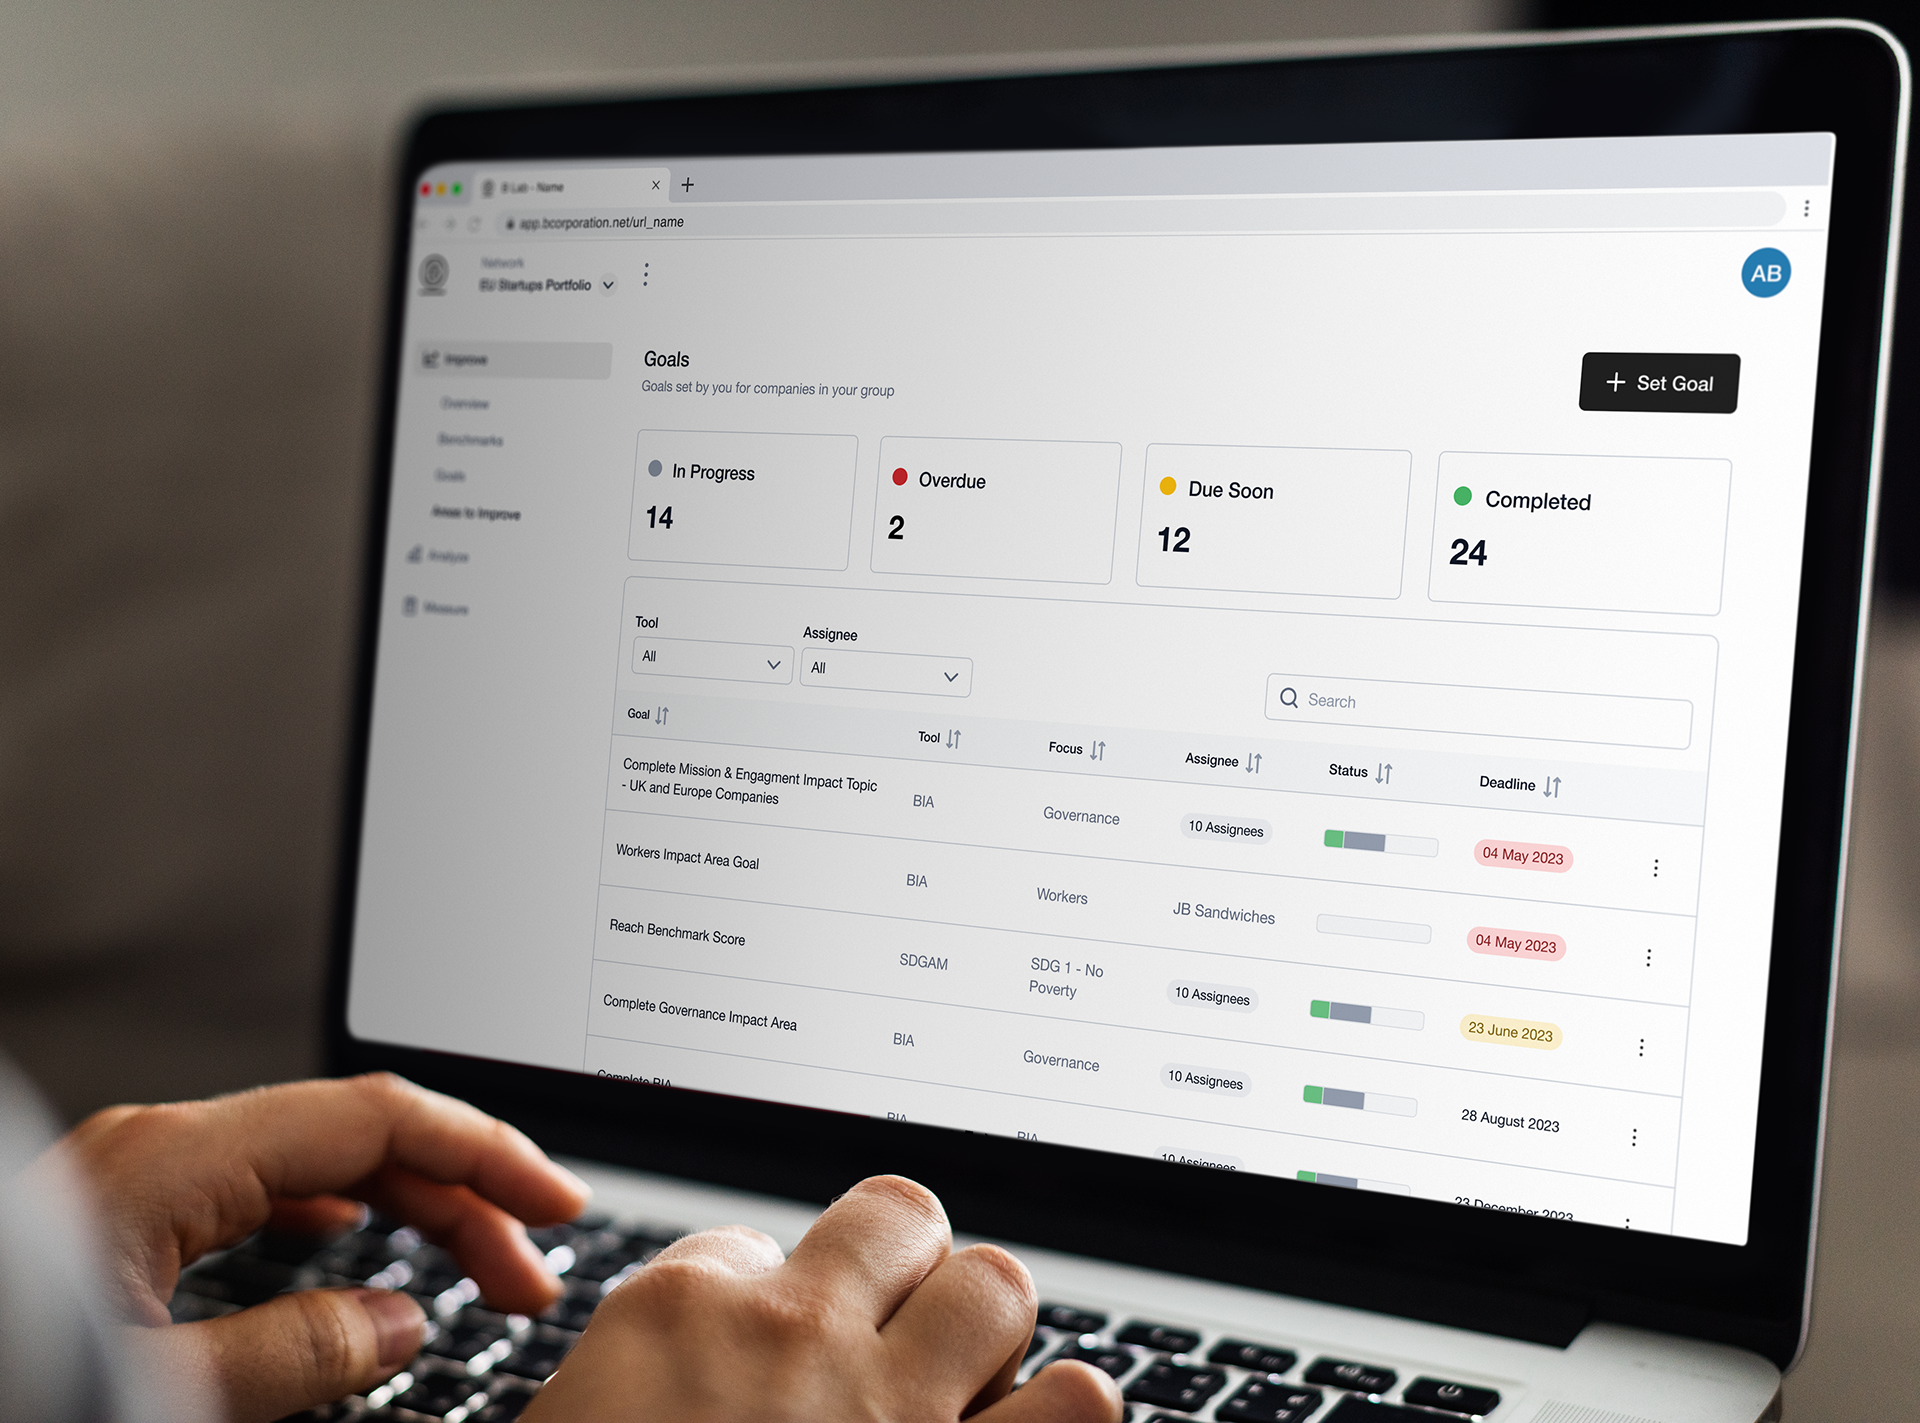
Goals to Drive Continuous Improvement
overview
Enable users to translate insights into action by setting measurable goals for specific impact areas, topics, or groups of companies.
problem solved
Before, benchmarks were static insights with no follow-through. By connecting goals directly to benchmarks, users can close the loop—tracking progress, aligning priorities, and achieving attainable targets.